Guide
How to build a competitive landscape slide quickly
A competitive landscape slide takes about two working days when the frame is fixed before the research starts: define the market by the customer's need, longlist players from filings and trade press, sort them into tiers, compare them on one share metric with its denominator stated, then write a headline saying what the structure means for the client.
What does a competitive landscape slide have to answer?
Three questions, in order: who competes for the customer's spend, how that spend is split, and what the split means for the client's decision. A slide that answers the first two is a directory. The third is the reason the partner asked for it.
That makes the landscape narrower than an industry analysis, which explains how a whole sector makes money, and broader than a competitor profile, which goes deep on one rival. It sits between them: every credible player on one page, compared on the same measures, with a conclusion on top.
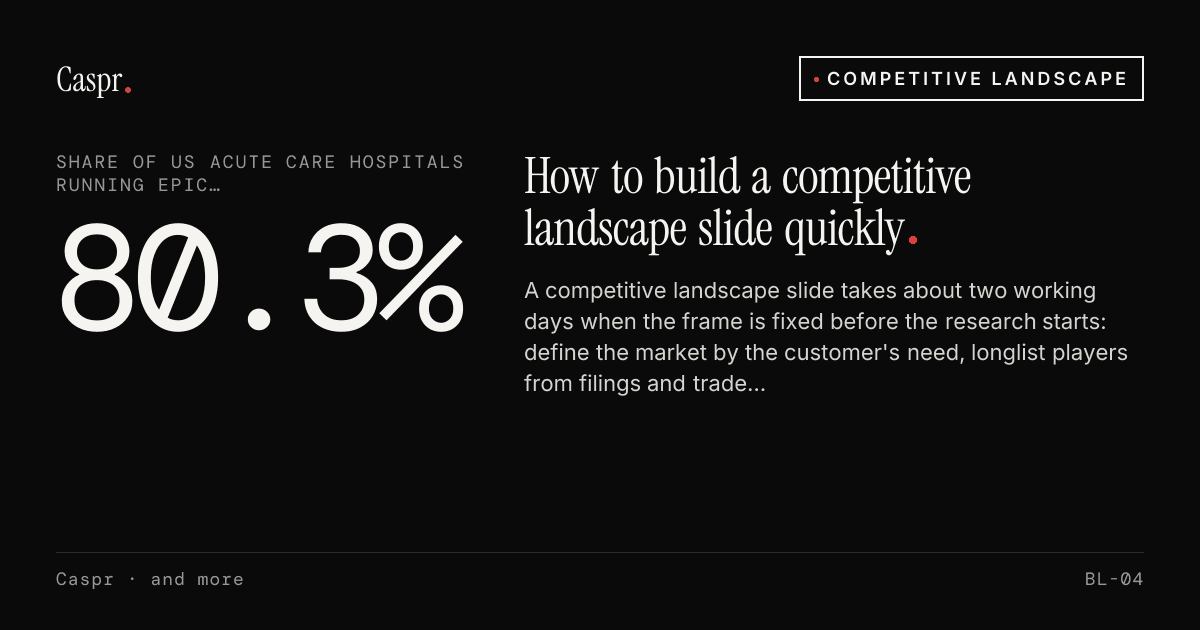
The conclusion is usually structural. In US acute care hospital software, three vendors — Epic, Oracle Health and MEDITECH — held 80.3% of hospitals in 2025. Any landscape of that market starts from the number, because it decides whether the client's real question is how to take share or which niche the leaders leave open.
Write the headline last, but know from the first hour that it is the deliverable. In the CompuGroup Medical example below, six columns and six rows exist to support one sentence: value it as a regional incumbent, not a global share gainer.
How do you build a competitive landscape in two days?
Most advice on how to do a competitive landscape analysis starts with sources. Under a Thursday deadline, start with the boundary. The costly mistake is research done before the market is defined and signed off: players collected for a market the partner did not mean, shares gathered on bases that cannot sit in one column. The plan assumes one market, eight to fifteen credible players and a partner review at the end of day two.
- 01First hour, day one: write the market boundary as one sentence — customer, need, geography, year — and get the partner's sign-off before any search starts. Example: the clinical record systems US acute care hospitals buy, 2025.
- 02Rest of the morning: longlist every company the customer could buy from instead, drawing on listed players' 10-Ks, trade-press share tables, buyer ratings and the client's own shortlists and lost-deal notes.
- 03Early afternoon: cut to the eight to twelve players a buyer would shortlist and sort them into MECE tiers by a rule you can state in one sentence. The CompuGroup Medical landscape used three: US acute care leaders, US ambulatory leaders, European incumbents.
- 04Late afternoon: choose one share metric, write its denominator into the column header — revenue, units, sites, beds or users — and attach a year to every number from then on.
- 05Morning, day two: fill three or four comparison columns that separate the players (scale, where each wins and source type in the template below), with a source and date in each cell, and label company-stated and estimated figures.
- 06Early afternoon: compute concentration — the top three's combined share and, where shares allow, the Herfindahl-Hirschman Index (HHI) — then write the headline as a finding about the client.
- 07Last two hours: pick the visual format that fits the headline, put the sources in the footer and run the slide against the five questions in the last section, from 'where is this share from?' to 'so what?'
Step one carries the most weight. 'Hospital software' and 'the clinical record systems US acute care hospitals buy' produce different player lists, different shares and a different headline. Sign-off on that sentence costs the partner two minutes in the first hour; discovering the disagreement on day two costs the slide.
Where does competitor data come from fast?
From the companies first, then from the organizations that count them (the US hospital shares in this guide come from KLAS-based reporting), then from the buyers.
| Source | What it gives the slide | Watch for |
|---|---|---|
| Listed players' 10-Ks and annual reports | Revenue, segment mix and the company's own account of its competition | Each company draws its own market boundary |
| SEC EDGAR full-text search | Every electronic filing since 2001 that names a given company | US filers only; private players appear only when others name them |
| Trade press and rating bodies | Share tables, net-new wins, buyer satisfaction rankings | Often a summary of a paid dataset: record the original source and its year |
| Private companies' own statements | Stated revenue, customer counts, launches | Unaudited: label as company-stated |
| Market size publishers | The total that shares are taken from | Scopes differ; one sector's estimates can sit more than twice apart |
| The client's own records | Shortlists, lost-deal reasons, win rates against named rivals | Describes the client's corner, not the whole market |
For a US market, the fastest single move is SEC EDGAR full-text search. Regulation S-K lists competitive conditions among the topics a listed company's business description covers, and the competition paragraph of a 10-K often names rivals outright. Search 10-K filings for the market leader's name, and the companies that count it as a competitor surface. The blank page becomes a longlist of firms that have declared they are in the market.
Private companies need a stricter rule. Separate what a company has disclosed from what has been inferred about it, compare private players on share, buyer ratings and product breadth, and leave a margin cell empty unless a reputable source states the figure. Epic, the largest vendor in the US example, is private: the template below gives its revenue only as press-reported and shows no margin.
Which market share figure belongs on the slide?
The one whose denominator matches the client's question, with that denominator in the column header. In 2025 Epic held 43.7% of US acute care hospitals and 56.9% of US acute care beds. Both figures are right. One counts sites, the other capacity, and the gap between them means the average Epic hospital is larger than the average hospital in the market.
| Vendor | Share of hospitals | Share of beds | What the gap says |
|---|---|---|---|
| Epic | 43.7% | 56.9% | Its hospitals are larger than average |
| Oracle Health | 21.9% | 20.4% | Close to the average hospital size |
| MEDITECH | 14.7% | 12.5% | Skews to smaller community hospitals |
| Top three combined | 80.3% | 89.8% | Concentrated on either count |
The column header is part of the claim. Under a bare 'Share' header, Epic's 43.7% and 56.9% look like a data error; under 'Share of hospitals' and 'Share of beds' they are a finding about hospital size. A column that switches basis halfway down cannot be read at all.
US antitrust practice offers a rule for choosing. The 2023 Merger Guidelines from the Justice Department and the Federal Trade Commission list revenues, unit sales, capacity and non-price indicators such as users among the bases for share, and single out revenue from recently won customers where buyers sign long contracts or face switching costs. Hospital software is that kind of market: installed-base share records past decisions, and a client deciding where to compete next needs recent wins beside it.
Then compute concentration, because it is often the headline. The same guidelines define the HHI as the sum of squared market shares and call a market above 1,800 highly concentrated. Using hospital and bed counts in place of revenue, Epic, Oracle Health and MEDITECH alone give US acute care an HHI above 2,600 on hospitals and above 3,800 on beds. The finding survives the choice of denominator, which is what lets a partner say it without a footnote.
Where no share data exists, the guidelines' own fallback works on a slide: count the significant competitors and show the gap between them and everyone else.
A market size on the same slide brings a wider spread. Estimates for global healthcare IT in 2026 run from $402.7 billion (Fortune Business Insights) to $998.8 billion (Grand View Research) — a difference in scope, not in the growth outlook, which both put in the mid-teens. Put one figure on the slide with its definition, and reconcile the market size estimates in the backup rather than on the page.
2x2, market map or comparison table: which format fits?
The format follows the headline. A finding about concentration needs shares; a finding about an open position needs a positioning view; a target screen needs the comparison table. Choosing the format first and hunting for a finding to fill it is how the 2x2 with the client in the top-right corner gets made.
| Format | Answers | Use it when | It fails when |
|---|---|---|---|
| Comparison table | How do the players differ on what matters? | Target screens, IC memos, client benchmarks | Columns follow the available data, not the real differences |
| Share bar | How concentrated is the market? | The headline is about structure: a leader, a tight group, a long tail | Shares sit on mixed bases or years |
| 2x2 matrix | Where is the open position? | Two evidenced attributes separate the players | The axes are picked to put the client top-right |
| Market map | Who plays in which segment? | The audience is new to the sector | It becomes a logo wall with no finding |
| Win, hold, lose grid | Where can the client compete? | The slide closes the section and the decision is where to play | No share or comparison slide stands behind it |
On a 2x2, test each axis with one question: could a skeptic place every company on it from public evidence? Price point and breadth of offering usually pass. 'Innovation' and 'customer focus' usually fail, and a sharp partner will ask how they were scored.
The same rules hold for a startup's competitive landscape slide, plus one: name the alternatives the customer uses today, including the spreadsheet and the incumbent nobody likes. An empty competitor slide reads as a market nobody has defined. An agency pitch carries the same risk in another form: a slide of the prospect's direct rivals that misses the substitutes the prospect actually worries about.
What does a finished competitive landscape template look like?
Six columns, one row per player, and nothing on the slide that is not in the table. The competitive landscape example below is filled from an analysis of CompuGroup Medical, a German health software vendor; the worked example explains how it was assembled.
| Player | Tier | Share (basis, year) | Scale (basis, period) | Where it wins | Source type |
|---|---|---|---|---|---|
| Epic | US scale leader | 43.7% of US acute care hospitals; 56.9% of beds (2025) | Private; revenue only from press reports | Large health systems; top health system suite, 2026 Best in KLAS | KLAS-based trade reporting |
| Oracle Health | US scale leader, losing ground | 21.9% of hospitals; 20.4% of beds (2025) | Reported inside Oracle; no segment margin | Installed base in large replacement tenders | KLAS-based trade reporting; Oracle filings |
| athenahealth | US ambulatory leader | Not disclosed on a comparable basis | Private | Independent physician practices; top practice suite, 2026 Best in KLAS, third year running | Company and KLAS award releases |
| Dedalus | European hospital incumbent | Not disclosed on a comparable basis | About €460 million revenue and 900 facilities on its Orbis system in German-speaking Europe (2025) | Large hospital tenders in German-speaking Europe | Company statements in German trade press |
| NEXUS | European hospital specialist | Not disclosed on a comparable basis | €261.5 million revenue; €57.6 million EBITDA (2024) | Specialty and hospital-adjacent niches | NEXUS annual report, 2024 |
| CompuGroup Medical | Regional multi-setting incumbent | Not disclosed on a comparable basis | €1.213 billion revenue, about 73% recurring (FY2025) | Ambulatory and pharmacy software in German-speaking Europe | CGM annual report, 2025 |
Read down the share column and the finding is visible: comparable share exists for the US hospital market and nowhere else. The analysis found no European shares on a common basis, so it compared scale, regional revenue and buyer ratings instead, and said so. A labeled gap survives a meeting; an estimate dressed as a share does not.
Then the headline, written as a finding the partner can read aloud: CompuGroup Medical wins in German ambulatory and European pharmacy software, holds in mid-market hospitals and loses flagship hospital tenders to Epic and Dedalus, so value it as a regional incumbent, not a global share gainer. 'Key players in health software' is a label; that sentence is a so what.
For an acquisition target, the same table becomes the competition half of the market section of an investment memo, with the target in the first row and the headline written about its position.
Before the slide goes to the partner, run it against the five questions the room asks: where is this share from, on what basis, from which year, why is this company missing, and so what? If the footer, the column header, the period labels, the boundary sentence and the headline answer them in that order, the slide is finished.
Worked example
Worked example: the landscape around CompuGroup Medical
The task: benchmark CompuGroup Medical (CGM), a German health software vendor with FY2025 revenue of €1.213 billion, against its competitors for investors and M&A buyers. A Caspr Market Research Study built the landscape in the order this guide sets out. Boundary first. The Study admitted a vendor on stated criteria: meaningful hospital or ambulatory share, relevance in German-speaking and Western Europe, overlap with CGM's ambulatory, hospital, pharmacy or interoperability products, or weight in current M&A and buyer ratings. Three tiers followed: US acute care leaders (Epic, Oracle Health, MEDITECH), US ambulatory leaders (athenahealth, eClinicalWorks) and European incumbents (Dedalus, NEXUS). Share came with its basis. Epic held 43.7% of US acute care hospitals and 56.9% of beds in 2025; the top three held 80.3% of hospitals and 89.8% of beds. With no comparable share for the European players, the Study compared scale instead: Germany (€684.5 million) and Western Europe (€356.1 million) produced about 86% of CGM's FY2025 revenue, against about €460 million of 2025 revenue for Dedalus in German-speaking Europe alone. Private vendors received no invented margins. The conclusion was a win, hold, lose read, not a ranking. CGM wins in German ambulatory software and European pharmacy software, where its pharmacy segment earned €156.0 million of 2025 revenue at a 32% adjusted EBITDA margin. It holds in mid-market hospital revenue cycle. It loses flagship hospital tenders to Epic and Dedalus, and broad US share to Epic and athenahealth.
The figures, side by side
| Publisher | Figure | Unit | Period | Basis | Published | Last verified |
|---|---|---|---|---|---|---|
| Caspr Study: CompuGroup Medical: Competitive Benchmarking | 43.7 | % of US acute care hospitals | 2025 | Hospitals using Epic as their acute care EHR, as a share of all US acute care hospitals (KLAS-based reporting) | August 2026 | 2026-10-17 |
| Caspr Study: CompuGroup Medical: Competitive Benchmarking | 56.9 | % of US acute care beds | 2025 | Beds in hospitals using Epic, as a share of all US acute care beds (KLAS-based reporting) | August 2026 | 2026-10-17 |
| Fortune Business Insights, via Caspr Study: CompuGroup Medical: Competitive Benchmarking | 402.7 | $ billion | 2026 | Global healthcare IT market, Fortune Business Insights scope | August 2026 | 2026-10-17 |
| Grand View Research, via Caspr Study: CompuGroup Medical: Competitive Benchmarking | 998.8 | $ billion | 2026 | Global healthcare IT market, Grand View Research scope | August 2026 | 2026-10-17 |
Where the numbers differ, and why
- definitionalEpic, US acute care EHR share, 2025: 43.7% of hospitals against 56.9% of bedsSame vendor, market and year; one counts hospitals, the other beds.
- definitionalGlobal healthcare IT, 2026: $402.7 billion against $998.8 billionFortune Business Insights and Grand View Research draw the market boundary differently; both put growth in the mid-teens.
Frequently asked questions
What should a competitive landscape slide include?
A competitive landscape slide needs a one-sentence market definition, eight to twelve players in tiers, and one share metric with its denominator and year. Add three or four comparison measures that separate the players, a dated source for every figure, and a headline on what the structure means for the client. Everything else goes in the appendix.
How many competitors should a competitive landscape include?
A competitive landscape usually covers eight to twelve competitors in tiers. That's enough for a customer to recognize the list as complete, and few enough to compare on one page. Show the long tail as one row with its combined share. Omitting a player the client sees as a threat costs more credibility than one extra row.
Is there a free competitive landscape slide template?
Yes, this guide's table is a free competitive landscape template: player, tier, share with its basis and year, scale with its period, where the player wins, and source. Build it in a spreadsheet first, then move it onto the slide in whatever format fits the headline: comparison table, share bar, 2x2 or a win, hold, lose grid.
How do you build a competitive landscape for an acquisition target?
Put the acquisition target in the first row and define the market by its customers, not by how the target describes itself. Compare it with the players buyers actually shortlist, on share, scale, revenue quality and buyer ratings, each dated. Close with where the target wins, holds and loses, because that read drives the memo's growth case.
How is a competitive landscape different from competitive intelligence on one rival?
A competitive landscape maps every credible player on the same measures to show market structure. Competitive intelligence goes deep on one rival: strategy, pricing, hires, product moves and likely next step. In this guide, the landscape places Dedalus as a European hospital incumbent; intelligence on Dedalus would explain how it wins the flagship tenders CompuGroup Medical loses.
Try it on Caspr
Benchmark a US dental practice management software company against its closest competitors for an IC memo: share and scale with basis and period, buyer ratings, and where the target wins, holds and loses.
Run the analysis